Crossing over of peaks is a very common event in Reaction Monitoring (RM) experiments. When this happens, the automatic alignment algorithm discussed in previous posts (here and here) might not work properly. To illustrate this issue, as I did not have a real experiment at hand, I simulated using Mnova a very simple data set comprised by a triplet and a singlet in such a way that the chemical shift of the triplet moves from 1.4 ppm to 0.7 ppm and having an exponential decay from spectrum to spectrum. This is depicted in the figure below, both as a stacked and a bitmap plot.
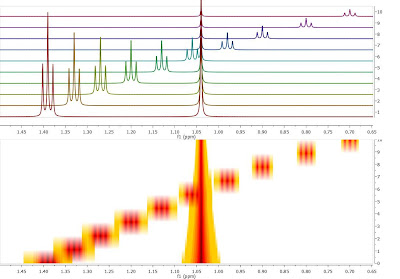
Now let’s say you are interested in extracting the intensities of the triplet as the reaction progresses. There is actually no need to pre-align the spectra algorithmically; it is much simpler to have some kind of graphical tool to instruct the software which peaks (or multiplets) need to be used for the reaction monitoring analysis. Let me show you how this works in Mnova:
First of all, in the Data Analysis module you select the region to be analyzed. As a starting point, the region will have a rectangular shape (green rectangle in the figure below):
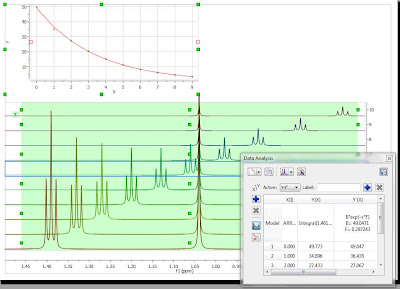
It can be noted that the graph shows an exponential decay, but the actual values must obviously be wrong as the values calculated, using the green rectangle as a boundary for the integration, include peaks from both the triplet and singlet, and we are interested in the analysis of the triplet resonances only. Now let’s change this…
The selection rectangle has a number of handlers (small green boxes). You can drag and move them freely so that you can adjust the selection feature to follow the triplet (BTW, the number of handlers can be adjusted. In this case, there are 6 handlers, but higher numbers are also permitted). In the figure below, the result of adjusting the handlers to follow the triplet is shown:
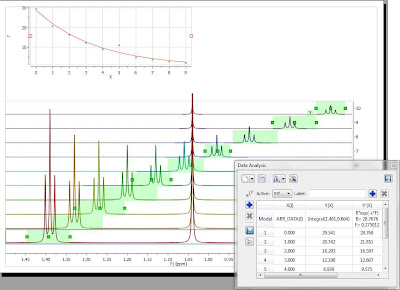
Now you can see that there is an outlier in the exponential curve which, obviously is caused by the singlet which overlaps with the triplet (spectrum number 6 which corresponds to data point #5, as in the graph the numbering starts from zero). Figure below shows that particular spectrum showing the singlet overlapping with the triplet:
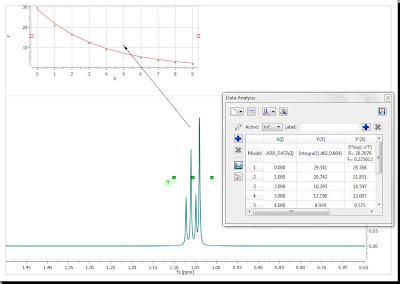
At this stage, there are several approaches. The simplest one is to just discard that point for the analysis, for example, by right clicking on that point in the graph and disabling it:
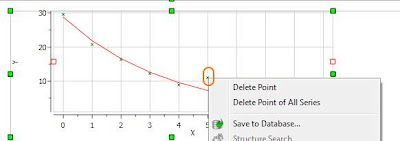
As soon as that point is deleted / disabled, Mnova will update the graph automatically. This is the new result:
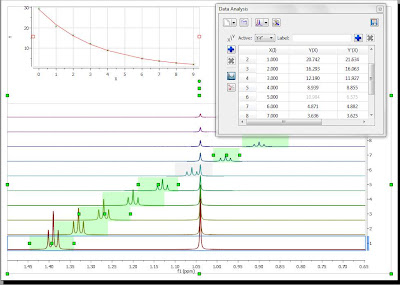
Another approach would involve using GSD to eliminate the singlet from the triplet so that it would not be necessary to discard the information from that particular spectrum. However, this is something I will blog about in a future post.

No comments:
Post a Comment