Saturday 14 October 2017

A Novel qNMR Technique: Quantitative Global Spectrum Deconvolution (qGSD)

Ever since chemists meddled (successfully) into NMR, with the pioneer work made by Proctor and Yu [1] more than 67 years ago, it was implicitly used as a quantitative technique. Indeed, from the very early days of NMR, it was found that the intensity (or area) of the NMR signals (under proper operating conditions) was proportional to the number of nuclides contributing to it. Already in 1953, Jarrett, Sadler, and Shoolery [2] showed the excellent precision of NMR (CW at that time) for the quantitative analysis of a tautomeric mixture, despite the limited measurement resources (see Figure below).
Figure 1. 1H-NMR spectrum from Reference [2]

Interestingly, quantitative analysis by NMR (qNMR from now on) is nowadays experiencing a kind of Renaissance with many applications in various fields, such as pharmaceutical and food sciences, manufacturing of reference materials, or metabolite determination in human body fluids. Furthermore, it is now being considered as an official analytical method for purity determination or assay of concentration of organic compounds.

From sum integration to qGSD

One of the key factors for the successful application of qNMR is the method used to estimate the peak integrals in the spectrum. This has been, and still is, largely dominated by the so-called sum integration in which the computer simply calculates the sum of all data points within a spectral region. It is well known that this method is very sensitive to phase or baseline distortions, but we can also assume that those spectral artefacts can be properly corrected (even fully automatically) by the NMR software.
The main problem of this method is its inability to deal with overlapping peaks. This is a particularly serious problem when an "external" signal overlaps within the area of interest. This signal can be solvent, it can come from another compound or even from the same compound itself.
This problem is illustrated in the 1H-NMR spectrum of Santonine (Figure 2).

Figure 2. 1H NMR spectrum of Santonine. Integrals calculated using standard sum method

Notice the multiplet at ~1.7 ppm that is contaminated with residual water peaks and therefore, the integreal corresponding to the proton 6’ is overestimated by a significant amount.
The contribution of that solvent peak could be removed by different methods, ranging from acquisition (e.g. pulse sequences for solvent suppression), post-processing or deconvolution techniques or a combination of the three.

Global Spectral Deconvolution (GSD) is a powerful alternative to the standard integration method providing a number of advantages. First, it is pretty insensitive to baseline distortions, although it requires the spectrum to be phase corrected. Most importantly, it can deal very efficiently with the problem of peaks overlap as it can be seen using the same example of Santonine used before.
(Figure 3)

Figure 3. 1H NMR spectrum of Santonine. Integrals calculated using GSD

Compared to the classical point-to-point integration, GSD yields better relative integrals, but the quality of the fit is not optimal (notice the residues under the spectrum). Nevertheless, they are generally of sufficient quality to be used all but the most demanding quantitation, It has been at the core of Mnova data analysis for many years, and has proved to be highly reliable and computationally efficient. However, whilst GSD has been designed to be used for problems involving automatic spectral analysis such us those required to perform molecular structure characterization, it was not intended for very accurate quantitative analysis (e.g. qNMR). 
GSD uses a Generalized Lorentzian function to model the experimental lineshapes.  This is a very flexible model that covers a broad range of shape variations for NMR resonances (Figure 4). 

Figure 4. The shape parameter in this graph ranges from –1.00 (blue) to +2.00 (red). For 0.00 (green), the line is a perfect Lorentzian. Red line is pure Gaussian and the gray lines are generalized Lorentzians.

The quality of the quantitation depends, amongst other factors, on how well theoretical models describe experimental NMR resonances. Careful analysis shows that even a flexible model like the Generalized Lorentzian cannot precisely fit all possible experimental lineshapes, as evidenced by non-zero fitting residual in Figure 3. 
In order to overcome some of the limitations of GSD, we have now introduced qGSD (quantitative GSD), available in Mnova 12. It is based on careful analysis of the residuals after GSD processing, and correcting GSD lineshapes in a way which minimizes the residuals. In Figure 5 we can see that now the residues are significantly smaller compared to the results obtained with plain GSD. 

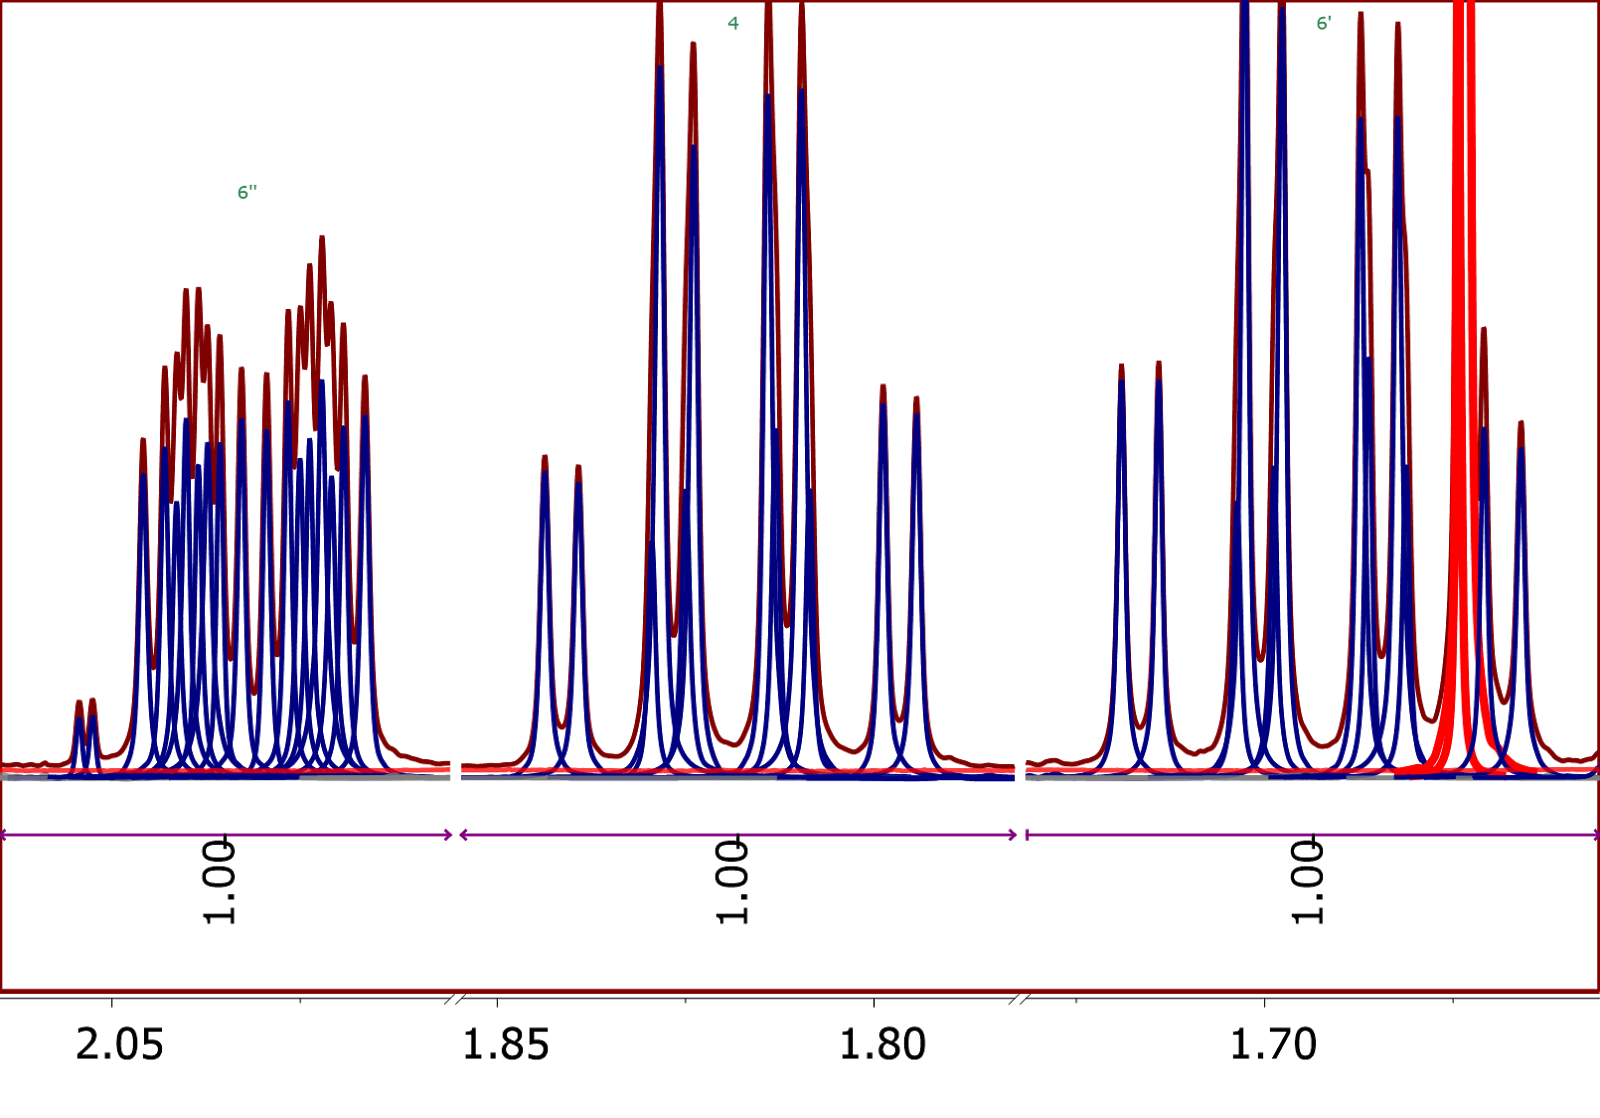
Figure 5. 1H NMR spectrum of Santonine. Integrals calculated using qGSD


Using qGSD with Mnova 12

In order to enable qGSD, it is necessary to access to the Peak Picking options in Mnova making sure that GSD method is selected (see Figure 6). 

Figure 6. Enabling qGSD in Mnova

Next, under the Advanced options, qGSD check box must be ticked and an appropriate number of Improvement cycles selected. A number between 5 and 10 usually gives good results. However, it is important to bear in mind that qGSD is computationally intensive: can take a couple of minutes, especially with a large number of cycles.
For this reason, it is recommended to use qGSD only when highly accurate integrals are needed. For other applications, such as multiplet analysis, or structure confirmation, plain GSD would be a more efficient method. 

qGSD with poorly shimmed spectra

To illustrate the lineshape flexibility offered by qGSD, a poorly shimmed spectrum has been used with GSD and qGSD (Figure 7). It is clear that qGSD does a much better job. That said, this should not not be a replacement for a properly acquired spectrum. 

Figure 7. qGSD vs GSD on a poorly shimmed spectrum

Conclusions

qGSD (quantitative Global Spectral Deconvolution) represents Mnova’s latest innovation that combines the power of deconvolution techniques to handle overlapped signals with the robustness of sum integration of isolated resonances but with the ability to deal efficiently with overlapped peaks.


Our preliminary tests demonstrate that qGSD is able to provide accuracy which is supperior to the sum integration even when there is signal overlap

References

[1] W. G. Proctor, E C.Yu, Phys. Rev 77,717 (1950)
[2] H. S. Jarrett, M. S. Sadler, and J. N. Shoolery, J. Chem. Phys., 1953, 21, 2092.


Sunday 8 October 2017

Free naming of organic structures

Mnova 12 contains some nice little gems that may be specially appreciated by organic chemists. For example, this new version features an improved molecular editor which includes a new tool for the generation of IUPAC names from a molecular structure.


At the moment, it only generates systematic names but next release of Mnova will also support trivial names

Is it really free?

When you download and install Mnova 12, you can get a license for the IUPAC Naming component, with no restrictions. We are still deciding the final licensing model for this feature, but for the moment, this license will be valid for 6 months.  

Saturday 30 September 2017

Improved User Experience with Mnova 12

In my last post I outlined the major User Interface change in Mnova 12. There are also another bunch of new little features aimed at making user experience even more agile and intuitive. In this post, I’m going to show a couple of them.

New spectral navigation tool

Whilst there were many tools in Mnova for the automatic analysis of NMR spectra, very often it is necessary to zoon in and out to get a closer look at different spectral regions in an interactive way. Mnova already had different commands for those operations but it lacked the ability to go back and forth between the different zooming operations. It was possible to use the undo/redo commands for that purpose, but this would not work if other commands were applied in-between two zooming comands.
Mnova 12 introduces two new commands that can be used to go to the previous or next zoom applied to the spectrum (1D or 2D). Those new command are available either in the View Ribbond tab or in the spectrum toolbar as shown in the picture below


.
It is also possible to use keyboard shortcuts: Shift + left/right arrow keys

Magnifying fonts

 Sometimes I get Mnova documents generated by someone else in which the font size of different elements is just too tiny. Changing the font size for the multiplet labels, scales, integrals, assignments, etc is a tedious and cumbersome task. 
Now by simply pressing Ctrl + or Ctrl -, all fonts in an Mnova document will be magnified up and down. It can also be done from the View tab as shown below:


Wednesday 27 September 2017

Mnova 12 Introduces a New Look and Feel

Yes, it is official, Mnova 12 has finally been released! There's quite a lot to tell about it: better interface (optional), new processing and analysis features, improved tools, 64 bits and so on.
Rather than making a comprehensive review on the new features of this version, I’m going to try to show the essentials changes in digestible chunks, starting with changes in the User Interface.

Embracing the Ribbon interface

Mnova started as an NMR only application with limited functionality. Over the years, the application has been growing steadily, both in terms of NMR functionality and the addition of new plug-ins such as LC/GC/MS, molecular editing, DB, just to cite a few. 
As a result, what initially fit seamlessly within a traditional user interface (with menu bars and toolbars), has become an increasingly complex application to navigate, particularly when more than one plug-in is installed. 
For a few years we have been analyzing carefully alternatives to de-clutter the user interface. After much discussion, we finally came to the conclusion that the Ribbon interface was really the one that best suited our needs (or, more importantly, yours).


One of the most interesting features of this interface is that it allows you to focus on a particular plugin (e.g. NMR) without the functionality of another plugin getting in the way.

Hate the Change? No problem

We understand that this change is drastic and not everyone will be happy with it. So, what if you absolutely hate this new interface? No problem, you won’t be forced to use it! You will just be able to switch it off in the Preferences (Modern == Ribbon).


Nevertheless, from my point of view, the Ribbon interface improves usability and User Experience and therefore I strongly recommend it ahead of the traditional User Interface. This is our first ribbon implementation and, therefore, I am sure it still has a lot of room for improvement. If you use it, any suggestions will be very welcome!

Friday 22 September 2017

ELNs and the importance of live analytical data

Setting the scene

Over the last 25 years, during my bachelor's degree, PhD, Post Doc, and now as director of R&D at Mestrelab, I have had the opportunity to interact with many organic chemists. Most of them, although with their own singularities, share relatively similar procedures and workflows, with their strengths and weaknesses. I have witnessed many advances in the way they conduct their research, but I also must say that there are some areas of it that remain firmly rooted in the past.

An example of the latter which I’m still seeing in many labs is the issue of data loss: In the particular case of academia, research teams are typically made up of (pre)doctoral or postdoctoral students whose residence time is usually between 3 and 8 years, roughly speaking.

During that period, they produce an enormous amount of spectroscopic data (NMR, GC/LC/MS, UV/IR, etc.) to characterize their molecules. Whilst some groups have some sophisticated IT infrastructures equipped with either in-house or third party DBs (including Mnova DB for analytical data), I think it is not unreasonable to say that most of them save their spectroscopy data on their personal computers (e. g. laptops) or in shared folders of their research group (e. g. Dropbox). Data leakage is the result as students leave.


If you're a principal investigator, I'm sure you've found yourself in the following situation: one of your students synthesized a compound some time ago. However, for some reason, you are now considering the possibility that the proposed structure may not be the right one. Obviously, to review this structure, you need to have access to the original spectroscopic data, but unfortunately, the student is no longer part of your research group and you have no way of locating the NMR spectra.

In the same plot line, some students only keep the spectroscopic data of the products that they have successfully synthesized but discard the data of those reactions that did not work in the way they had planned.

These are just two examples of what I consider to be a more general problem associated with the difficulty of efficiently managing analytical information in an organic chemistry laboratory.

Nowadays, many labs are moving from paper-based to electronic laboratory notebooks (ELNs) that offer significant benefits for long-term storage. However, most of them lack the capability to understand and handle spectroscopy data in an integrated manner. Some of them are just repository of PDFs of analytical data generated by some specialized software. This is, in my opinion, a very limited, unproductive and inefficient solution to the extent that data generated in this form has been dubbed as “dead data” where all the valuable spectroscopy information has been removed, reducing it to a series of unstructured set of images and text strings. As it is stored today, analytical data is virtually unusable and tasks like the ones listed below are simply impossible to perform:


  1. NMR data could have been processed incorrectly making a comprehensive analysis of the data unfeasible.
  2. Only some parts of the spectrum could have been reported or the resolution is too low to characterize a compound unambiguously. For instance, accurate determination of coupling constants, inspection of possible impurities or side products in a reaction would not be possible.
  3. Spectroscopic data search: Do I have any spectrum that contains a triplet at 3.5 ppm? This is a question that could not be answered with dead data.
  4. Do I have any spectrum similar to this one?

Some ELNs, in addition to PDF or plain images, also store raw data but do not offer a solution with real spectroscopy intelligence capabilities within a searchable and homogeneous environment.

Mbook 2.0: A spectroscopy-aware ELN


Our ELN, MBook 2.0 is our answer to those issues. It has been designed to take advantage of all the power of Mnova which is tightly integrated with Mbook and is responsible for processing the analytical data acquired by the chemist. The scientist only needs to send the data in a zip file and Mnova will automatically recognize the file format (NMR data such as those from Bruker, JEOL, Varian / Agilent, Magritek, Thermo picoSpin, Nanalysis as well as many LC/GC/MS and UVIR files) and process in a fully unattended way. As a result, a new Mnova document is generated on the fly and saved into the ELN.


This file can be accessed and viewed directly from within Mbook with a new spectral viewer which provides basic navigation tools such as zoom-in and out.  

At this present time Mbook 2.0 does not include spectral search capabilities, but we expect to offer this feature shortly once the integration of Mbook with Mnova DB is completed